Freight Types & Categories
From temperature-controlled produce to oversized construction materials, we find high-paying loads for every freight category. Our dispatchers know the rates, seasonality, and handling requirements for each type.
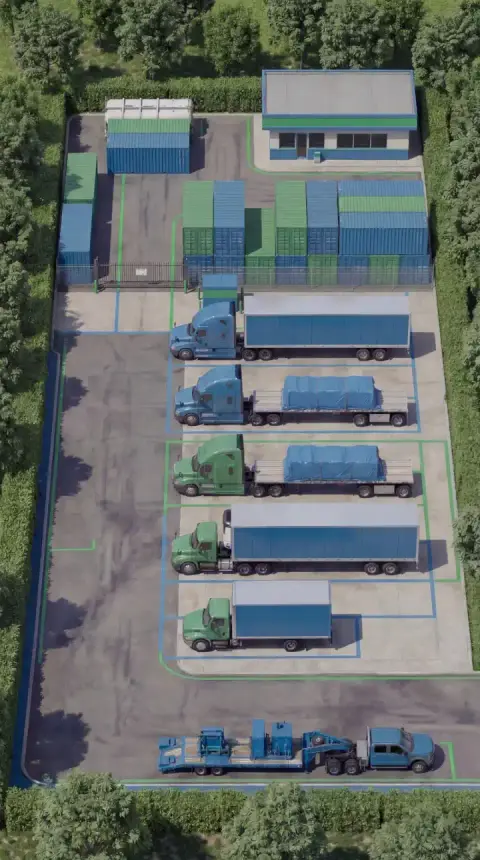
All Freight Categories
12 freight types with expert dispatch strategies, real market data, and proven lane intelligence

Produce & Perishables
Produce and perishable freight accounts for roughly $48 billion in annual US trucking revenue, with over 3.1 million reefer loads moved each year. California's Central Valley alone ships 250+ commodities across 6.8 million acres of farmland, generating outbound loads that pay $3.10-$3.60/mile during peak harvest from April through October. Florida and Georgia round out the top three origin states, with winter strawberry and citrus runs from Plant City and Vidalia onion season creating rate spikes of 20-35% above baseline.

Automotive Parts & Vehicles
The US automotive freight market moves $120+ billion in parts and finished vehicles annually, with 1.2 million truckloads of components flowing between 300+ assembly plants and 4,000+ tier-1 suppliers each month. Michigan-to-Tennessee and Ohio-to-Texas corridors dominate, with JIT parts loads paying $2.90-$3.40/mile and finished vehicle transport on car haulers averaging $0.55-$0.70 per mile per unit. Assembly plant shutdowns during model changeovers (typically July and December) create predictable freight dips of 25-35%.

Construction Materials
Construction freight represents a $78 billion annual market in US trucking, moving 2.8 billion tons of aggregates, steel, concrete, and building materials each year. Flatbed and step deck dominate — 70% of construction loads require open-deck equipment — with per-mile rates averaging $3.25-$3.80/mile for tarped loads. The market tracks closely with housing starts (1.4 million in 2025) and federal infrastructure spending ($550 billion from the IIJA), making it one of the most predictable high-paying freight categories when you know the seasonal cycles.

Retail & Consumer Goods
Retail freight is the backbone of dry van trucking, representing $190+ billion in annual US transportation spend across 12 million truckloads per year. The market is dominated by major distribution center corridors — Walmart alone operates 190+ DCs generating 80,000+ loads per week. Rates average $2.60-$3.10/mile on core lanes, but Q4 holiday surge (October-December) pushes spot rates 25-45% above contract as retailers race to stock shelves for $960 billion in holiday sales.

Energy & Oil Field
Energy freight encompasses the transport of drilling equipment, pipe, frac sand, completion chemicals, and production materials to and from oil and gas fields — a $35 billion annual trucking market that tracks directly with rig counts. When the US rig count runs above 600 (currently around 580-620), flatbed and specialized carriers in the Permian Basin (TX/NM) and Bakken (ND/MT) earn $4.00-$6.50/mile on loads that other freight categories cannot match. The catch: volume swings 30-50% within 90 days based on crude oil price movements, requiring dispatchers who can pivot fast.

Manufacturing & Industrial
Manufacturing freight moves $165 billion in raw materials, components, and finished goods between 320,000+ US factories each year, generating 9.5 million truckloads annually. The Midwest-to-Southeast corridor (OH/IN/MI to TN/GA/AL) carries 35% of this volume, driven by automotive, aerospace, and consumer goods production. Rates average $2.85-$3.30/mile for standard dry van, with premium lanes hitting $3.60/mile for JIT and expedited shipments. Manufacturing is the most consistent freight category — plants run 250+ days per year with predictable output.

Pharmaceuticals & Medical
Pharmaceutical freight is the highest-value, most regulated category in trucking, with the average load valued at $750,000-$2.5 million and some gene therapy shipments exceeding $10 million per pallet. The US pharma logistics market is worth $22 billion annually, with 850,000+ temperature-controlled shipments per year. Carriers must maintain GDP (Good Distribution Practice) compliance, and a single temperature excursion can destroy an entire $1.2 million load of insulin or biologics. Rates run $4.00-$6.50/mile, reflecting the extreme insurance requirements and handling standards.

Beverages
Beverage freight is one of trucking's heaviest and most consistent categories, moving 13.8 billion cases per year across 4.2 million truckloads. A fully loaded 53ft trailer of bottled water or canned beverages hits 43,000-45,000 lbs — right at the legal limit — making weight compliance the defining challenge. The market is dominated by Coca-Cola, PepsiCo, and Anheuser-Busch InBev, whose 600+ bottling and brewing facilities generate 95,000+ loads per week. Rates average $2.70-$3.20/mile on core lanes, with summer peak (May-August) pushing rates 15-20% above baseline as consumption spikes 30%.

Electronics & Technology
Electronics freight moves $95+ billion in consumer electronics, components, data center hardware, and semiconductor products across 2.8 million US truckloads annually. Average load values range from $200,000 for consumer electronics to $3.5 million for server racks and semiconductor wafers, making cargo theft the category's defining risk — electronics account for 23% of all cargo theft incidents despite being only 4% of total freight volume. Rates run $3.20-$4.50/mile on standard lanes, with white-glove data center deliveries commanding $5.00-$7.00/mile. The market peaks in Q3-Q4 as consumer product launches and holiday inventory drives a 35-45% volume surge.

Lumber & Building Products
Lumber and building product freight moves 45 billion board feet of lumber and $180 billion in building materials annually, generating 3.8 million flatbed loads per year across the US. The Pacific Northwest (WA, OR) produces 40% of domestic softwood lumber, with rates from mill to lumberyard averaging $3.40-$4.20/mile on flatbed. Lumber prices are notoriously volatile — random-length lumber futures swung from $350 to $1,700 per thousand board feet between 2020-2024 — and freight volume tracks housing starts with a 60-90 day lag. When lumber prices spike, mills ship everything they can produce and flatbed rates surge 20-30% within weeks.

Agriculture & Grain
Agricultural freight is the original trucking category, moving 4.5 billion bushels of grain, 180 million tons of animal feed, and $120 billion in farm products annually across 5.2 million truckloads. Harvest season (September-November) creates the most intense freight surge in trucking — flatbed, hopper, and dry van rates in the Corn Belt (IA, IL, IN) spike 25-40% in a 6-week window as 90 million acres of corn and 87 million acres of soybeans hit elevators simultaneously. Rates average $2.80-$3.40/mile for standard ag loads, with harvest-season hopper bottom runs commanding $3.60-$4.20/mile.

Hazmat & Chemical
Hazmat freight encompasses the transport of flammable liquids, corrosive chemicals, compressed gases, explosives, and radioactive materials — a $28 billion annual US market that requires DOT HazMat endorsements, specialized equipment, and compliance with 49 CFR Parts 171-180. Only 6.8% of CDL holders carry a HazMat endorsement, creating a permanent capacity shortage that drives rates 40-80% above dry van. Tanker loads of industrial chemicals average $3.80-$4.60/mile, with specialized hazmat flatbed (UN cylinders, IBCs) paying $3.40-$4.00/mile. The chemical corridor from Houston to New Jersey moves 40% of US hazmat volume and is the highest-paying consistent lane in trucking.
Why Freight Category Matters
Different freight types have wildly different rates, seasonality, and handling requirements. A dispatcher who knows the nuances of your freight finds loads that pay 15-40% more than generic load board searches.
Rate Intelligence
We track seasonal rate patterns across every freight category to position your truck where rates are peaking
Compliance & Handling
Every freight type has specific requirements. We ensure every load matches your equipment and certifications
Geographic Expertise
We know exactly which regions generate the highest-paying loads for each freight category, every month of the year
Rate Premiums by Freight Type
How each freight category compares to standard dry van rates
| Freight Category | Rate Premium |
|---|---|
| Produce & Perishables | +15-30% |
| Automotive Parts & Vehicles | +5-20% |
| Construction Materials | +20-40% |
| Retail & Consumer Goods | +0% (baseline) |
| Energy & Oil Field | +40-80% |
| Manufacturing & Industrial | +5-15% |
| Pharmaceuticals & Medical | +50-120% |
| Beverages | +0-10% |
| Electronics & Technology | +25-60% |
| Lumber & Building Products | +20-35% |
| Agriculture & Grain | +0-15% |
| Hazmat & Chemical | +40-80% |
*Rate premiums are averages compared to standard dry van freight. Actual rates vary by lane, season, and market conditions.
Ready to Haul Higher-Paying Freight?
Our dispatchers specialize in every freight category. Tell us what you haul and we will find loads that maximize your revenue.